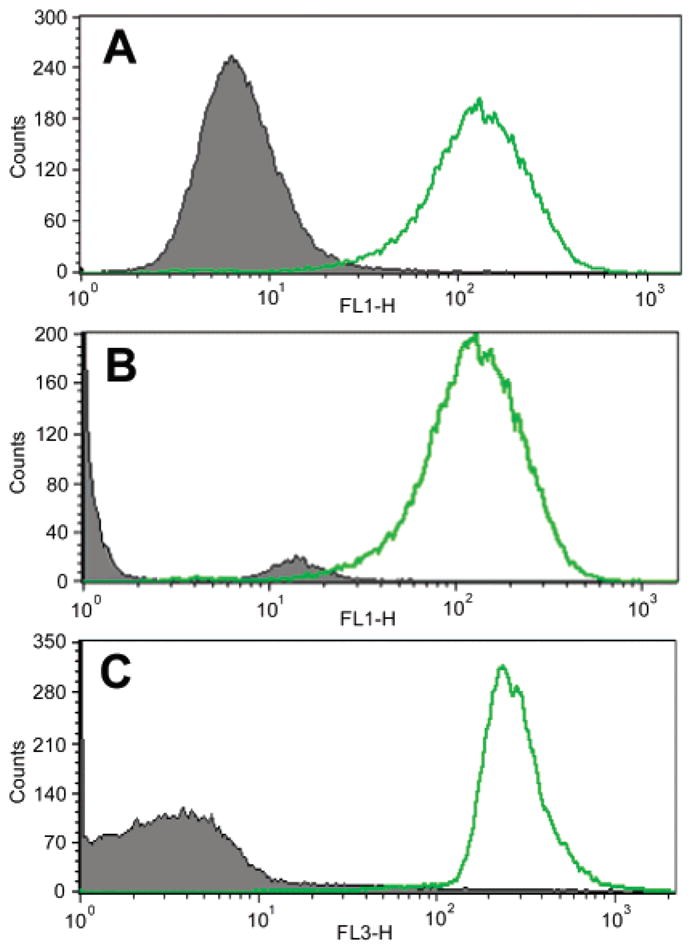
Figure 5.

FACS analysis histograms: (A) green fluorescence (FL1) obtained with Jurkat cells stained with FITC–anti-CD3ε (open curve) or FITC isotype IgG1 (shaded curve); (B) green fluorescence obtained with Jurkat cells (open curve) or LLC cells (shaded curve) stained with FITC–anti-CD3ε; (C) red fluorescence (FL3) obtained with Jurkat cells (open curve) or LLC cells (shaded curve) stained with 16a–anti-CD3ε.
