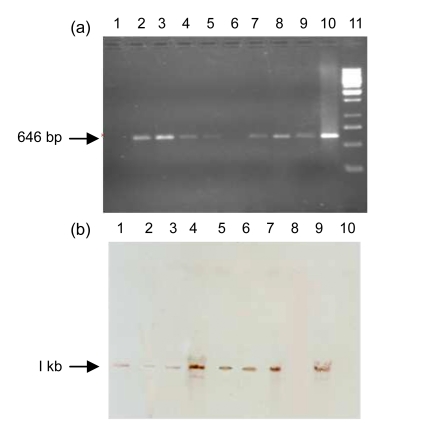
Fig. 1.
PCR (a) and Southern blot (b) analyses of PHYB transgenic plant DNA
(a) Lanes 3–9: putative transgenic plants QCC2, QCC5, QCC7, QCC10, QCC11, QCC14, and QCC15; Lane 1: negative plant control (QCC21); Lane 10: positive plasmid control; Lane 2: blank; Lane 11: 1 kb Ladder. (b) Lanes 1–7: samples (QCC2, QCC5, QCC7, QCC10, QCC11, QCC14, and QCC15); Lane 8: negative plant control (QCC21); Lane 9: positive plasmid control; Lane 10: λ/HindIII marker

