
Figure 5.
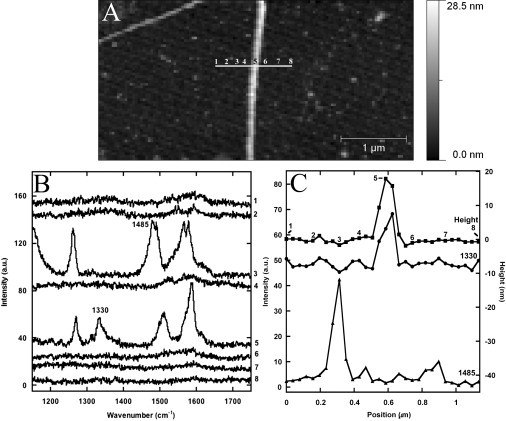
Tip-enhanced Raman line scan of a Collagen I fibril collected in tapping mode in air at an oscillation amplitude of 10 nm. (A) AFM height image of the Collagen I fibril obtained with a TESP-SS cantilever before Raman line scanning. (White horizontal line across the fibril) The 1.14 μm path of the Raman line scan. (B) The tip-enhanced Raman spectra at different points along the 30 point path. (C) Height profile of the Collagen I fibril after Raman profile (squares) and the intensities of the 1330 (circles) and 1485 cm−1 (triangles) peaks along the Raman line scan. The height profile and the intensity profile at 1330 cm−1 both have a FWHM of 100 nm.