
Figure 7.
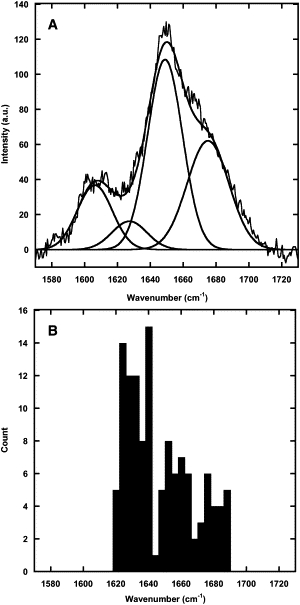
Comparison of the diffraction-limited and enhanced Raman Amide I peaks for Collagen I fibrils. (A) Peak fitting of the Amide I band observed in a sheet of collagen presented in Fig. 1B. The positions, height, and FWHM of the Gaussians are presented in Table 1. (B) Histogram of the Amide I peak positions observed in SERS and TERS. The average FWHM of the Amide I band in 42 silver SERS, 37 gold SERS, and 29 silver TERS spectra used were 27 ± 12 cm−1, 22 ± 11 cm−1, and 15 ± 7 cm−1, respectively.