
Figure 1.
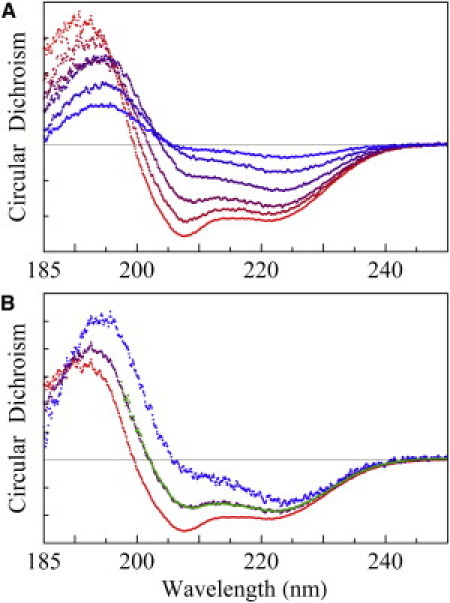
OCD. (A) Bottom red spectrum is the OCD of an open sample of P/L = 1/50, unchanged from 50% to 100% RH. As excessive water condensed on the sample, the spectrum gradually changed in time from bottom to top (the blue color content of the spectra increased with time), whereas the amount of sample in the CD beam path decreased because the surface of the sample slowly slid downward. It took 40 min of continuous OCD scanning from the red to the blue spectrum. The scan time for each spectrum was ∼4 min, including the resetting time, at 1 nm bandwidth, 0.1 nm/point, and 20 nm/min scan rate. Ten spectra were taken, but for clarity only five are shown. (B) At the appearance of the top blue spectrum in A (rescaled in B), the sample was open to 50% RH and held horizontally for ∼10 min. This made the sample stop flowing, and the spectrum turned to the bottom red curve. The blue and red spectra were obtained from the same amount of sample (blue, I spectrum for helices normal to the bilayers; red, S spectrum for helices parallel to the bilayers). The green spectrum was obtained from a sandwiched sample in a swollen state, fit by a linear combination of the I and S spectra (0.4 I + 0.6 S; purple line), indicating that 40% of the helices were oriented normal to the bilayers.