
Figure 2.
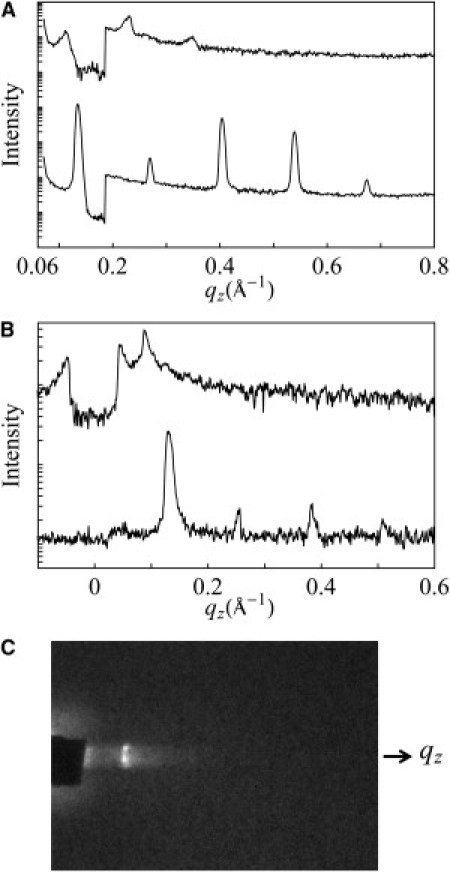
(A) X-ray lamellar diffraction by θ–2θ scan from an open sample of P/L = 1/50 equilibrating at 98% RH (bottom) and 100% RH (top; with an attenuator below q = 0.19 Å−1). Note that at 100% RH, the peaks were strongly damped by layer undulations (30). (B) X-ray grazing-angle scattering from an open sample of P/L = 1/50 equilibrated at 60% RH (bottom) and (top) in a swollen state (covered by a mylar sheet; also with an attenuator below q = 0.04 Å−1). Note that in the swollen state, the first-order peak has the characteristic power-law line shape as predicted by Caillé's theory (12,14) due to layer undulations in the swollen lamella. (C) Grazing-angle scattering from the swollen lamella (B) recorded on the CCD detector, which was oriented with the z axis vertically up. The beam center was at the baseline. The rectangular diffraction peak image was the shape of the x-ray beam cross section. The intensity profile along the z axis is shown at the top of panel B.