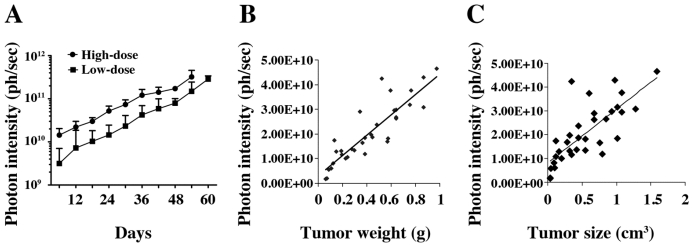
Fig 3.
In vivo tumor growth curve. A. Tumor growth was measured by bioluminescence photometry. The day when the mice were injected with the tumor cells was set as d1. The photometry of the in vivo imaging was accumulated by software Living Image 3.1.0 (Caliper Life Sciences) and the resulting photon counts were plotted as the Y-axis. Error bars represent the standard deviation from measurement of four mice in each corresponding group. At the end of the study, mice were sacrificed; tumors were immediately removed and measured by weight, size and fluorescence. Association of photon intensity with tumor weight (B) or size (C) was also performed. A stronger correlation between bioluminescence and tumor weight is shown (correlation coefficients are 0.77 for weight and 0.57 for size).

