
Figure 2.
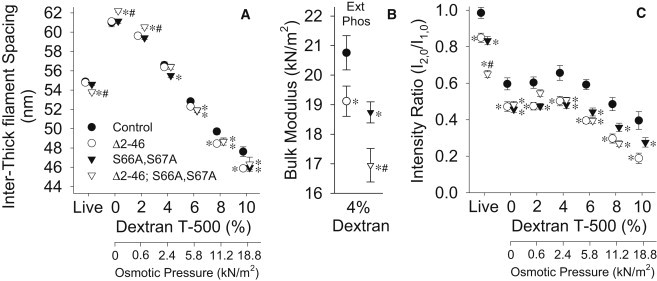
Inter-thick filament spacing (A) and intensity ratio, or I2,0/I1,0 (C) of IFM from resting, live flies and relaxed fibers compressed with dextran T-500 (% w/v) for RLC mutants and control. Note that some symbols are hidden (e.g., control at 2% dextran) behind overlapping measurements. Bulk modulus (B), or compressive elastic modulus, calculated at 4% dextran T-500 from the relationship between inter-thick filament spacing and osmotic compression for relaxed fibers. Within dextran concentration: asterisk (∗) indicates a significant difference from control; pound sign (#) indicates a significant difference from Δ2-46 and S66A,S67A; and Ext and Phos indicate significant differences between N-terminal extension length (normal versus truncated) and phosphorylation sites state (normal versus disrupted), respectively. Fibers examined: Δ2-46 = 15; S66A,S67A = 15; Δ2-46; S66A,S67A = 10; and control = 12.