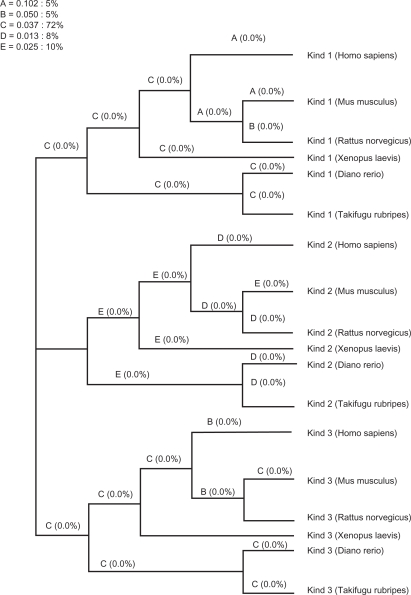
Figure 4.
Lineage-specific analysis of selective pressure in vertebrate Kindlins. A cladogram is shown with maximum-likelihood estimates of lineage-specific dN/dS during during verterbrate Kindlin evolution. Percentages for branch classes in the legend reflect the proportion of total tree length (measured in expected substitutions per site per unit time) evolving under the corresponding value of dN/dS.
Note: While letters A, B, C, D and E represents each branch class.

