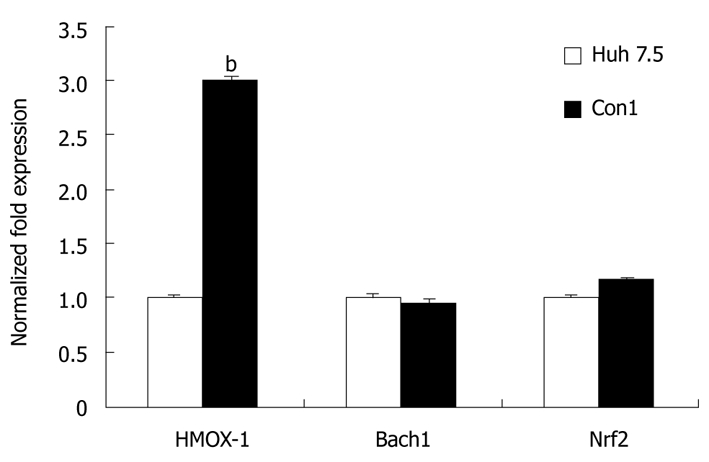
Figure 6.

HMOX-1, Bach1, and Nrf2 mRNA levels in CON1 vs Huh 7.5 cells. The levels of HMOX-1, Bach1, and Nrf2 mRNA in untreated Huh 7.5 and CON1 cells were quantified using quantitative reverse transcriptase polymerase chain reaction as described in “Materials and Methods”. The amounts of HMOX-1, Bach1 and Nrf2 mRNA were normalized to GAPDH. Data for mRNA levels are mean ± SE. bP < 0.01 vs Huh7.5.
