
Figure 2.
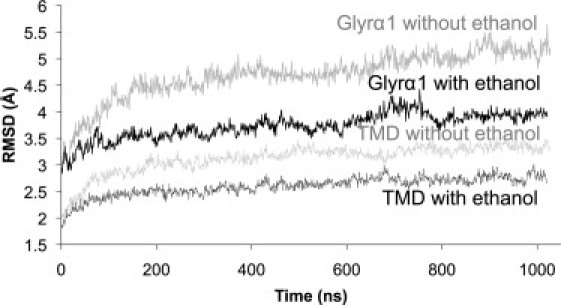
RMSD of GlyRα1 from the initial homology model structure. The black and gray lines represent the GlyRα1 with and without ethanol, respectively. The solid lines indicate the Cα RMSD of the whole protein, and the dashed lines are the Cα RMSD of the TMD, including residues 220–410 (the TM3-TM4 loop was replaced with three glycines).