
Figure 4.
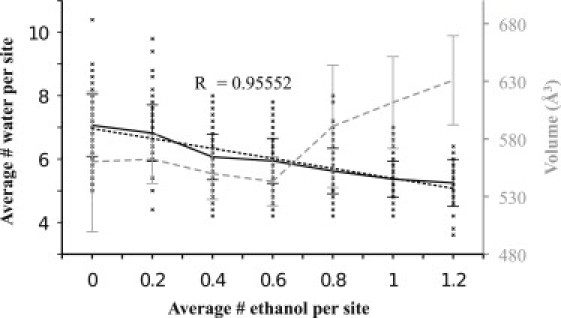
Correlation between the average number of ethanols present per site versus the instantaneous amount of water and volume of the allosteric binding site. Crosses indicate the number of waters (left axis) in a cavity as a function of the number of ethanols in the same site, from 1-ns averages. The solid black line indicates the average for each amount of ethanol, with standard deviations. A linear fit (dotted black) shows that each ethanol replaces ∼1.5 waters. The average van der Waals volume of the cavity (gray dashed curve, right axis) also exhibits a clear increase with the average number of ethanols present in the cavity.