
Figure 6.
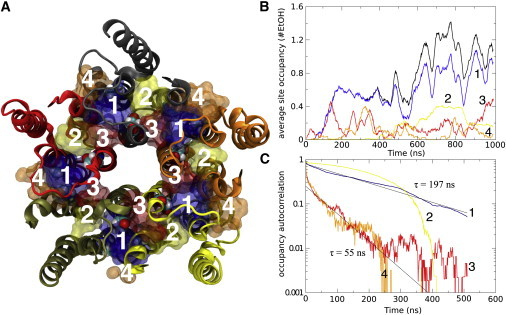
Ethanol binding and exchange. (A) Representation of GlyRα1 TMD showing the potential allosteric intersubunit binding site (site 1), an intrasubunit site (site 2), a pore-accessible site (site 3), and a surface/membrane-facing site (site 4). (B) Average occupancy of ethanol molecules per single binding site over the simulation, colored according to the site. The black line shows the sum of all deep inter- and intrasubunit sites (occupancy clearly is highest in the intersubunit site). (C) Autocorrelation occupancy/nonoccupancy of ethanol molecules that exhibit occupancy at some point in the simulation, colored according to the site. An exponential fit indicates exchange times of ∼200 ns for the deep binding sites. The average exchange time for the surface sites is <10 ns, but there is also a small component (<20%) with an ∼55 ns exchange time for these sites.