
Figure 4.
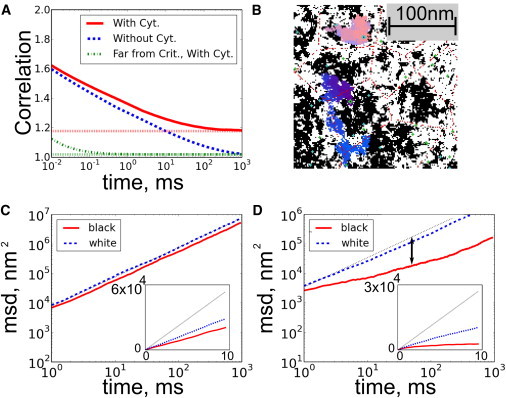
Membrane dynamics and component diffusion are sensitive to criticality and connectivity to the cortical cytoskeleton. (A) Near the critical point (Tc = 0.95 T), time-time correlation functions for membranes without coupling decay slowly and become uncorrelated after ∼1 s (dashed blue line). In the presence of coupling to the cortical cytoskeleton, the fluctuations remain correlated even after long times (higher dotted red line at infinite times). By contrast, systems that are far from critical (dash-dotted green line, Tc = 0.5 T) are uncorrelated after a fraction of a millisecond, and coupling them to the cytoskeleton makes them decay to a small, nonzero value (lower dotted green line). (B) Dynamics at Tc = 0.95 T are also measured by tracking components through simulation time steps. Tracks for single black (pink) and white (blue) strongly coupled diffusers are shown (see text). (C and D) MSDs are calculated from many traces and indicate that weakly coupled black lipids are slightly confined (C), whereas more strongly coupled black crosses are more strongly confined (D). Freely diffusing particles have MSDs that are linear in time (dashed line in C and D with slope 1, or linear in inset). We quantify the confinement by the ratio of D100μs/D50ms, whose log is the length of the double-sided arrow. (Color online.)