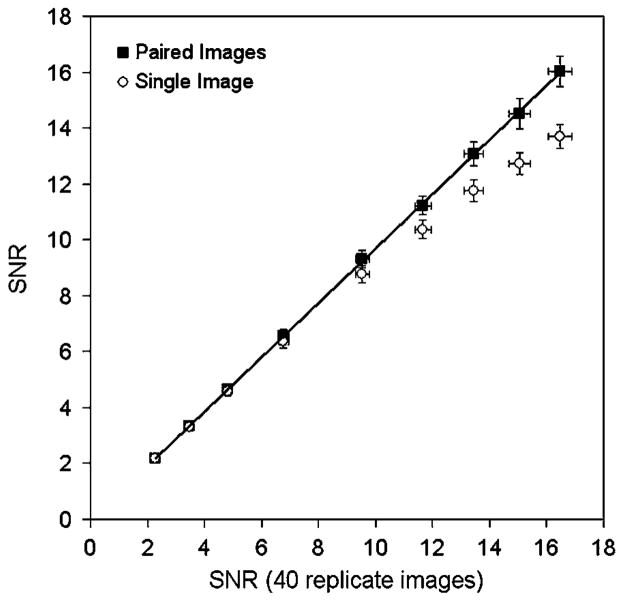
Figure 4.
Signal-to-noise ratios determined using three different methods for a range of images with different noise levels (1, 2.5, 5, 10, 20, 30, 40, 50, 60 million total true counts). The data are shown as a function of the SNR estimate obtained from 40 replicate images (method A). Solid squares denote data obtained with the proposed method involving the difference of paired images (method B). Open circles denote the data obtained by simply dividing the mean by the standard deviation of all pixels in a single image ROI (method C). The solid line indicates a linear fit to the data derived from method B (y = 0.97x − 0.03). All images were acquired on the Discovery RX in 2D mode.

