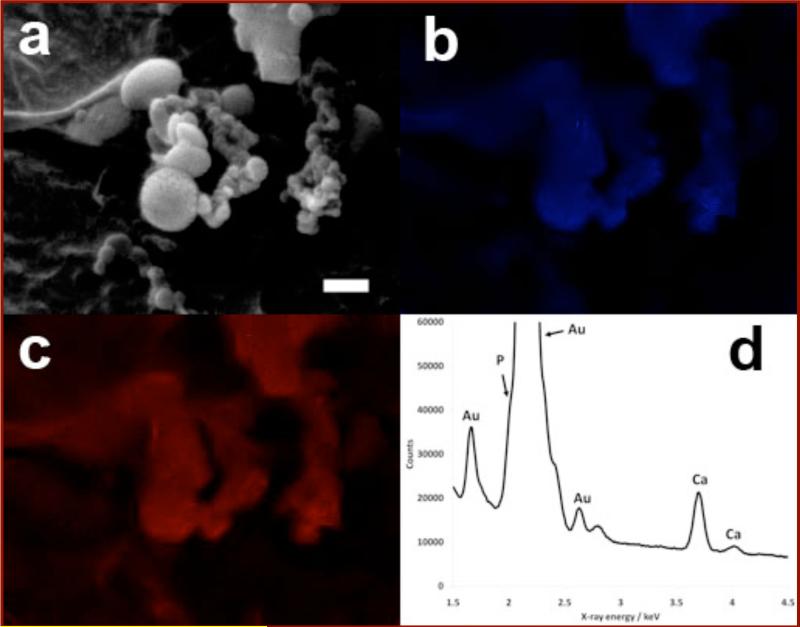
Figure 5.
SEM images and EDXA mapping of the pseudo-spherical particles observed in the rP148+40En sample. The brightness and contrast of the EDXA maps were altered for clarity. (a) A low resolution SEM image of the area that was mapped. Scale bar 500nm. (b) The EDXA map of calcium (Ca-Kα x-ray radiation at 3.691 keV). (c) The EDXA map of phosphorus (P-Kα x-ray radiation at 2.013 keV). It is important to note that the sample was coated in gold and some of the phosphorus signal may have come from Au-Mα x-ray radiation at 2.120 keV, although the Au-Mα and P-Kα spectral windows do not overlap. (d) The EDXA spectrum of the particles. The calcium Kα and Kβ peaks are clearly visible, but the phosphorus Kα peak only appears as a shoulder on the side of a large gold Mα peak.

