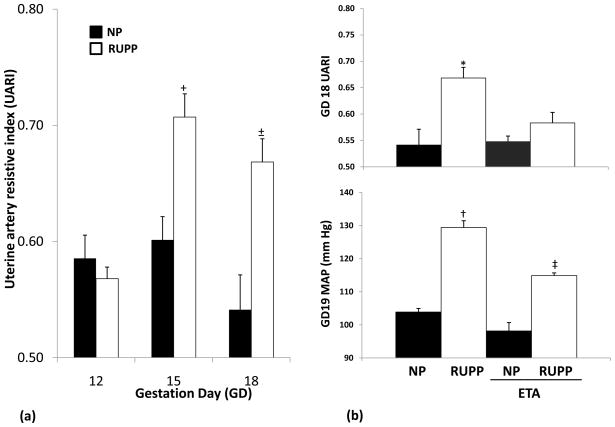
Figure I.
(a): Uterine artery resistive index changes by gestation day (GD) in NP and RUPP dams. All data are expressed as mean ±SEM. +P <0.05 vs. NP GD 12, NP GD 15, NP GD18 and RUPP GD 12. ±P <0.05 vs. NP GD 12, NP GD 18 and RUPP GD12.
(b): Uterine artery resistive index and mean arterial blood pressure in NP and RUPP dams with and without ETA pretreatment. All data are expressed as mean ±SEM. *P <0.05 vs. NP, NP/ETA and RUPP/ETA. †P <0.05 vs. NP, NP/ETA, RUPP/ETA. ‡P <0.05 vs. NP, NP/ETA and RUPP.

