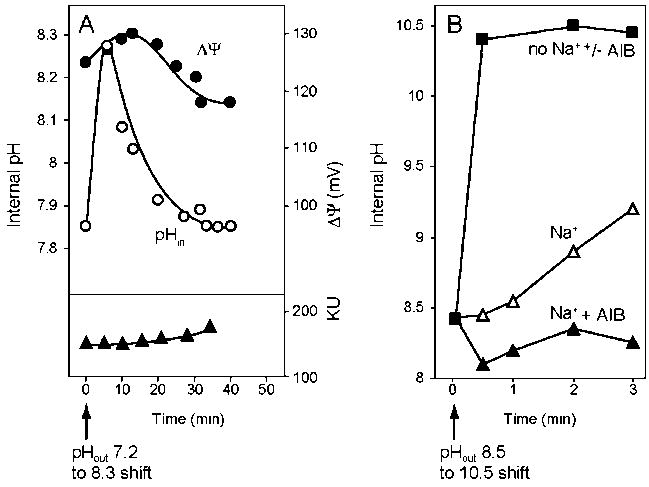
Figure 2.
Alkaline pH shift experiments with E. coli and alkaliphilic B. pseudofirmus RAB. A. E. coli cells were grown logarithmically at pH 7.2 in minimal glycerol medium batch cultures before the pH of the medium was adjusted to 8.3 over 30 seconds. A rapid method of cytoplasmic pH and ΔΨ determination in intact cells has made it possible to follow the time course and sequence of changes occuring following the pH shift [58]. Growth was also assed (Klett units). The data are replotted from Figure 3 in reference [58] with permission from the American Society for Microbiology. B. Washed pH 10.5-grown cells of B. pseudofirmus RAB were equilibrated in potassium carbonate buffer at pH 8.5 and then rapidly shifted to pH 10.5 buffer with either 50 mM potassium carbonate (“no Na+”, with or without added AIB), 50 mM sodium carbonate (“Na+”) or 50 mM sodium carbonate + 500 μM AIB. The cytoplasmic pH was monitored after the shift. The figure is a modified version of Figure 3 from reference [61], with permission from the American Society for Biochemistry and Molecular Biology.

