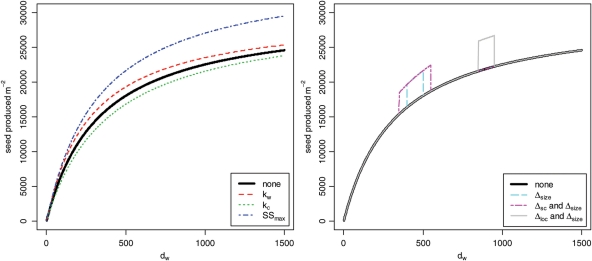
Fig. 2.
Plots showing how increasing three parameters of the crop– weed competition sub-model (left) and parameters of the perturbation function (right) affects the shape of the function describing weed seed produced m−2 versus weed density m−2. Parameters were increased by 20 %, except for Δloc and Δsc, which were increased by 100 %.

