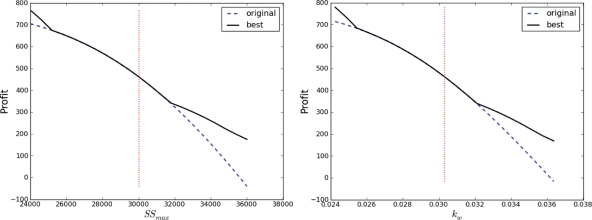
Fig. 5.
Profitability of the original optimal sequence and the actual optimal sequence changing for different values of the crop–weed competition parameters SSmax (left) and kw (right). Note that these figures are very similar but not identical. In each case, the region where the two lines overlay corresponds to the region where the original optimal sequence is still the actual optimal sequence for the changed competition parameter value.

