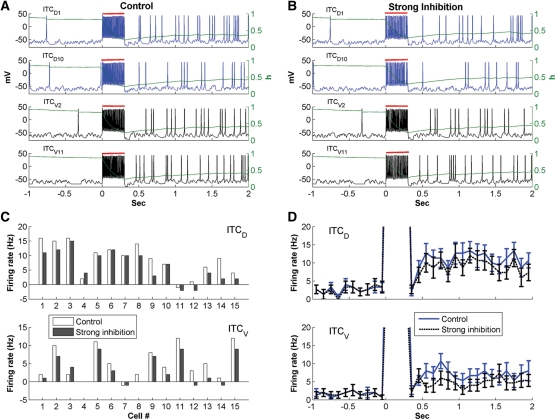
Figure 5.
Persistent network activity elicited by transient excitatory inputs. (A,B) Voltage responses of ITCD1, ITCD10, ITCV2, and ITCV11 for the control ( ; A) and strong inter-ITC inhibition (
 ; B) cases. Evolution of the inactivation variable (h) of the ISD current is shown in green. The red bars indicate the duration of the transient input. (C) Difference between the steady-state firing rate and spontaneous rate of individual ITCD and ITCV neurons. (D) Instantaneous firing frequency of ITCD and ITCV neurons as a population. Error bars indicate SEM and bin width is 100 msec; same in Figure 6.

