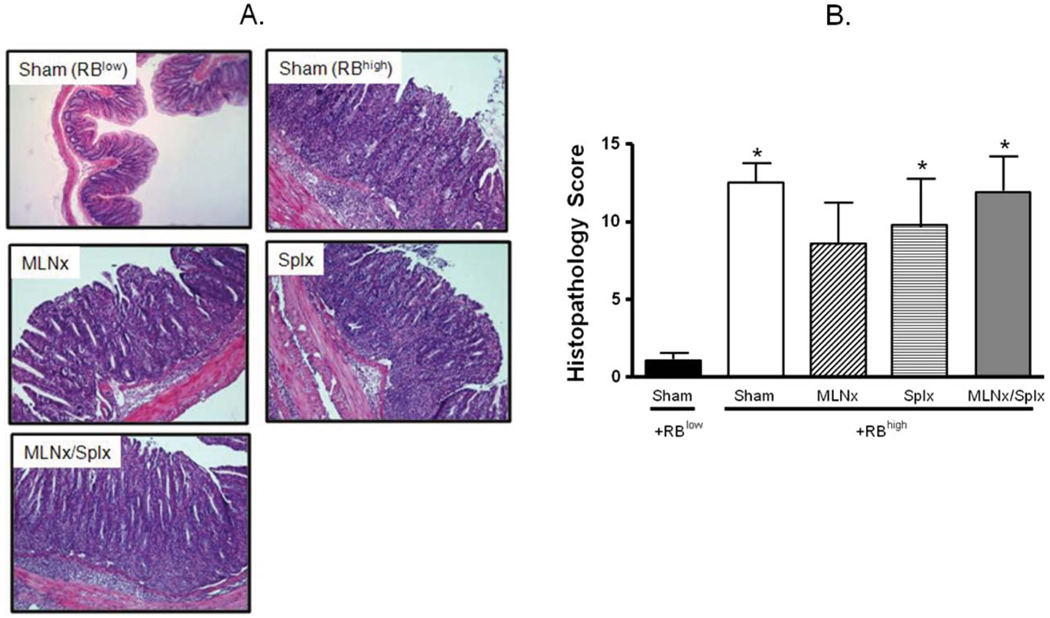
FIGURE 3.
Histopathology at 8 weeks following T-cell transfer. (A) Representative histopathology. (B) Blinded histopathological scores of colons were assigned by a pathologist unaware of the treatment groups using our previously published scoring criteria.27 Data represent means ± SEM for n = 6–8 mice in each group. Comparisons between groups were determined by one-way ANOVA followed by Dunnett’s post-hoc test; *P < 0.05 versus RBlow group.

