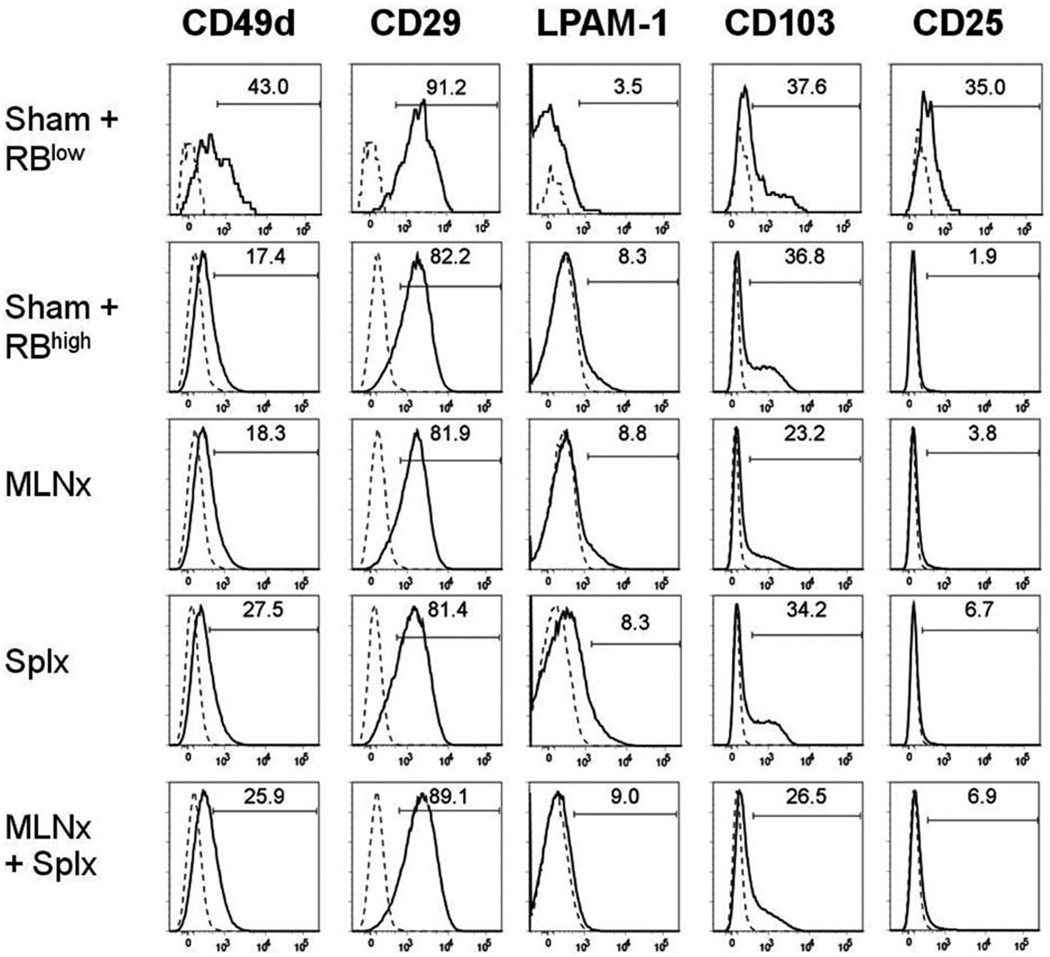
FIGURE 5.
Expression of different surface markers on CD4+ T cells isolated from the colonic lamina propria of RAG−/− mice reconstituted with naïve T-cells. Surface expression of CD49d (α4 integrin), CD29 (β1 integrin), LPAM-1 (α4β7 integrin), CD103 (αE integrin), and CD25 on CD4+ T cells were analyzed using flow cytometry. Solid lines represent staining with mAb specific for the indicated molecules, whereas the broken line represents the isotype control staining. Numbers represent the percentage of positive cells for each surface molecule among CD4+ T cells. Data shown are representative of at least two separate experiments with 2–4 mice/group.

