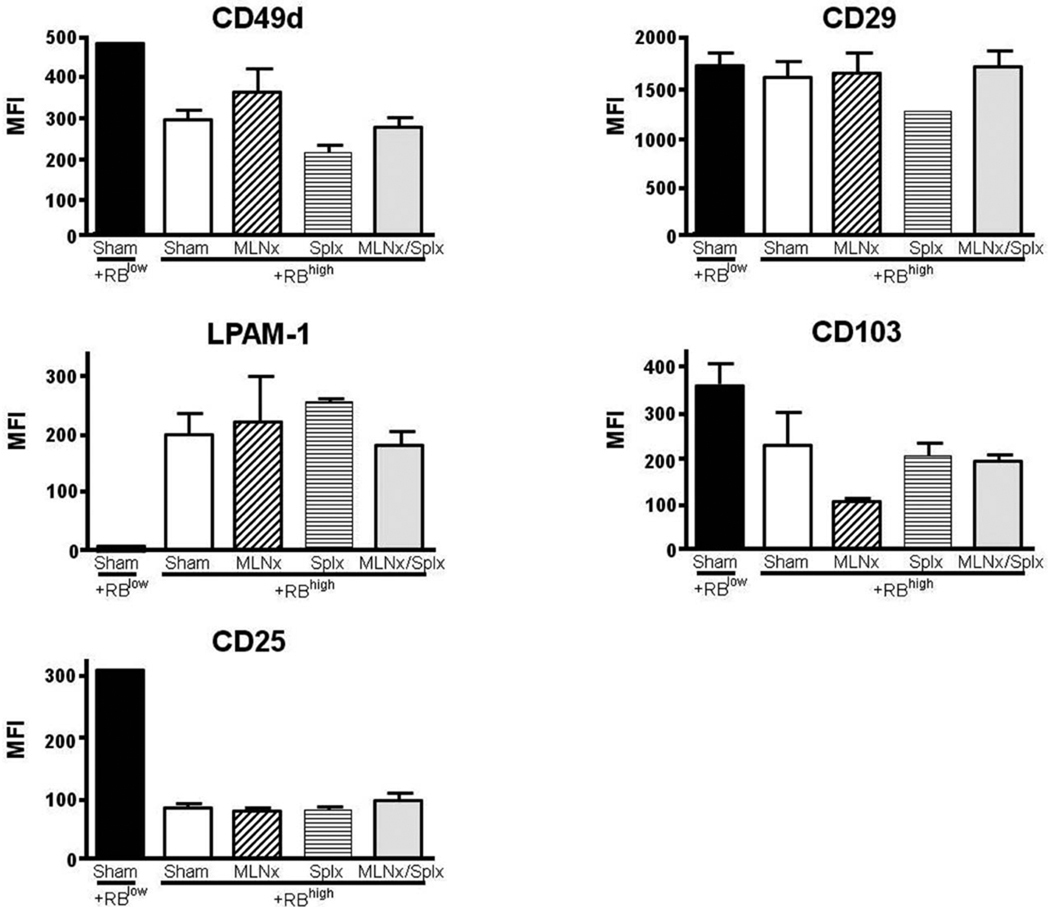
FIGURE 6.
Median fluorescence intensity (MFI) of different surface molecules on CD4+ T cells obtained from the colonic lamina propria of RAG−/− mice reconstituted with naïve T-cells. The MFIs of (A) CD49d (α4 integrin), (B) CD29 (β1 integrin), (C) LPAM-1 (α4β7 integrin), (D) CD103 (αE integrin), and (E) CD25 expression on CD4+ T cells were obtained using FlowJo software. Data represent means ± SEM. Comparisons between groups were determined by one-way ANOVA.

