Figure 3.
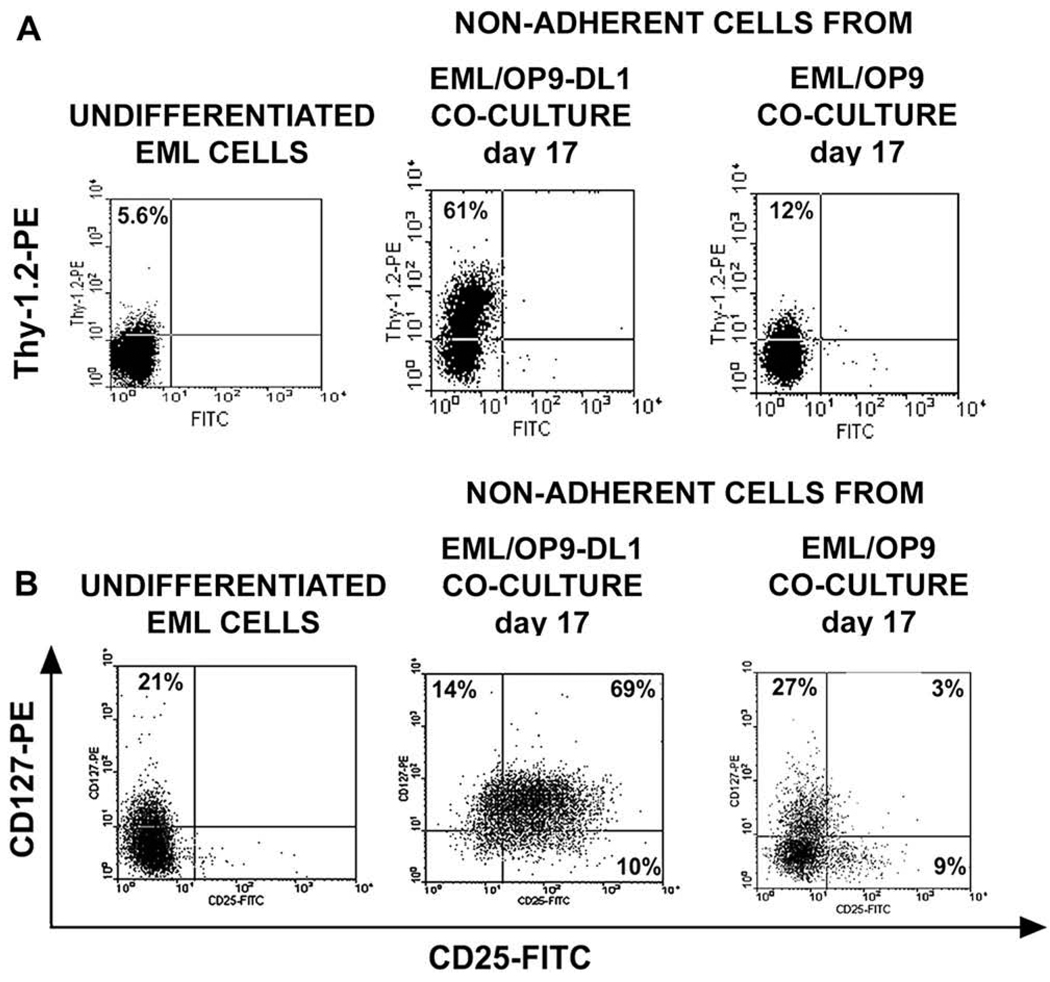
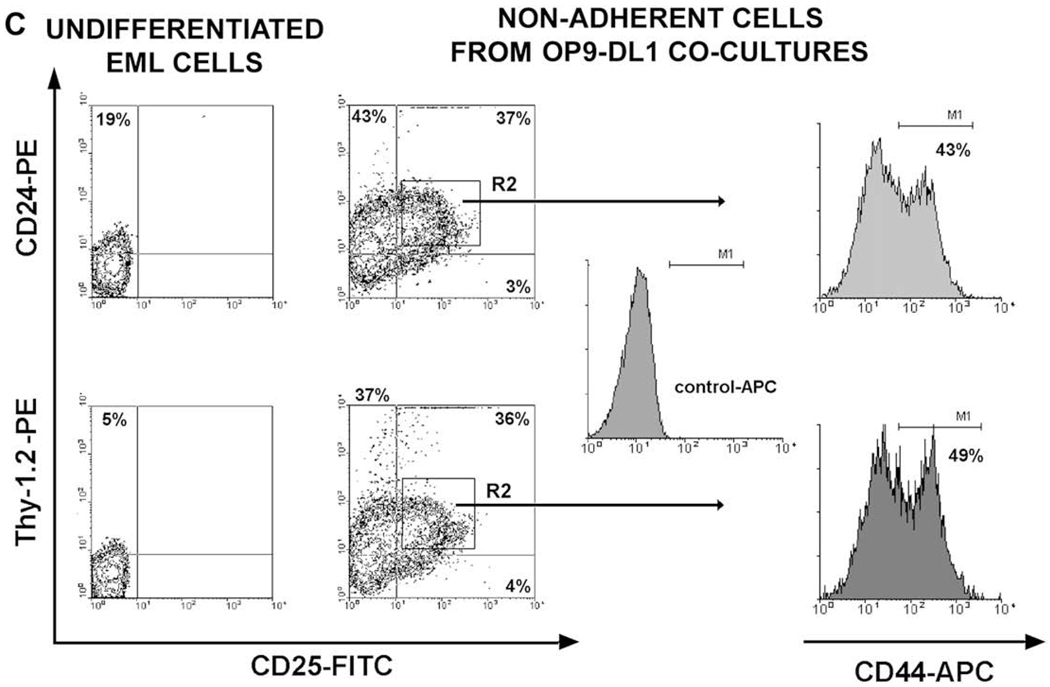
In OP9 stromal cells expressing Notch ligand Delta-like 1 (OP9-DL1) cocultures EML cells differentiate into double-negative (DN) cells that coexpress CD25, Thy-1.2, interleukin-7 receptor-α (IL-7Rα), CD24, and CD44 markers. Flow cytometry analysis of (A) Thy-1.2 expression and (B) CD127 (IL-7Rα) and CD25 coexpression on undifferentiated EML cells, and nonadherent EML (naEML) cells from day 17 EML/OP9-DL1 and control EML/OP9 cocultures. (C) Flow cytometry analysis of CD24, Thy-1.2, CD25, and CD44 coexpression on undifferentiated EML cells and naEML cells from day 17 EML/OP9-DL1 cocultures. The contour plots on the left show the analysis of CD24, Thy-1.2, and CD25 coexpression on undifferentiated EML cells and naEML cells from EML/OP9-DL1 cocultures. CD44 expression was analyzed by three-color flow cytometry among CD24+CD25+ and Thy-1.2+CD25+ naEML cells in the upper right quadrant (R2 gate) of contour plots. Histograms on the right show the expression of CD44 on R2 gated CD24+CD25+ and Thy-1.2+CD25+ naEML cells. The numbers in histograms represent percentage of CD44-positive cells based on the allophycocyanin (APC) control staining.


