Figure 5.
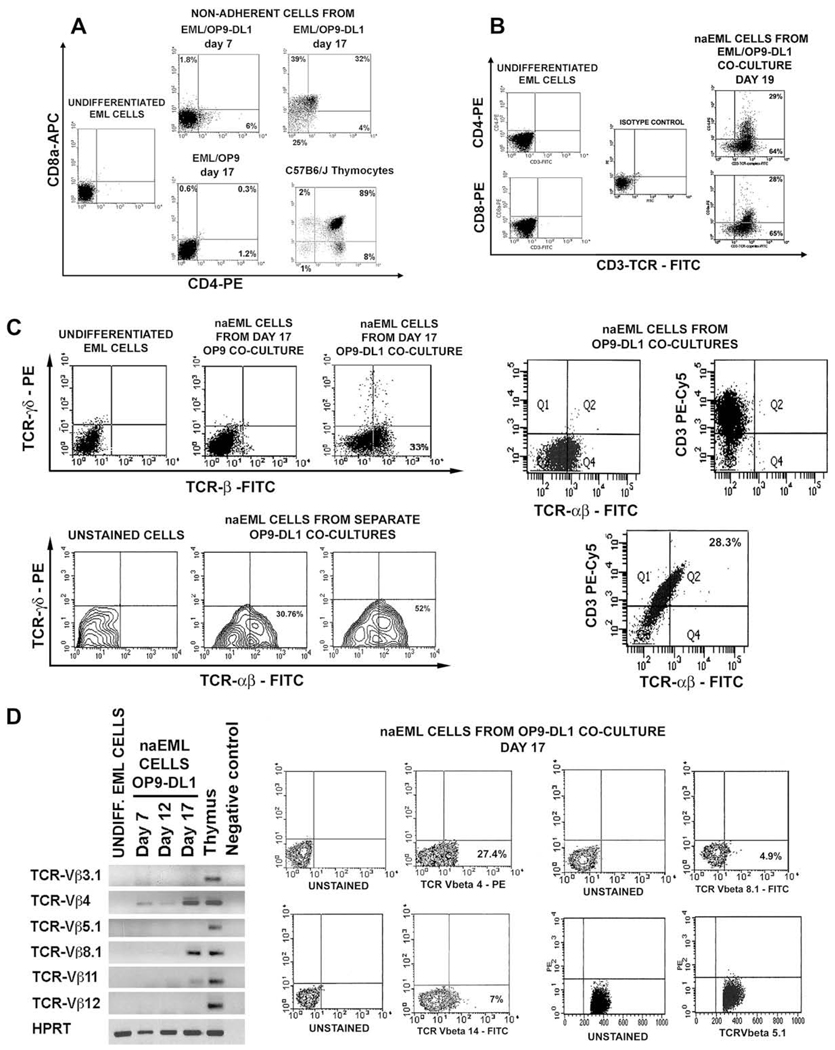
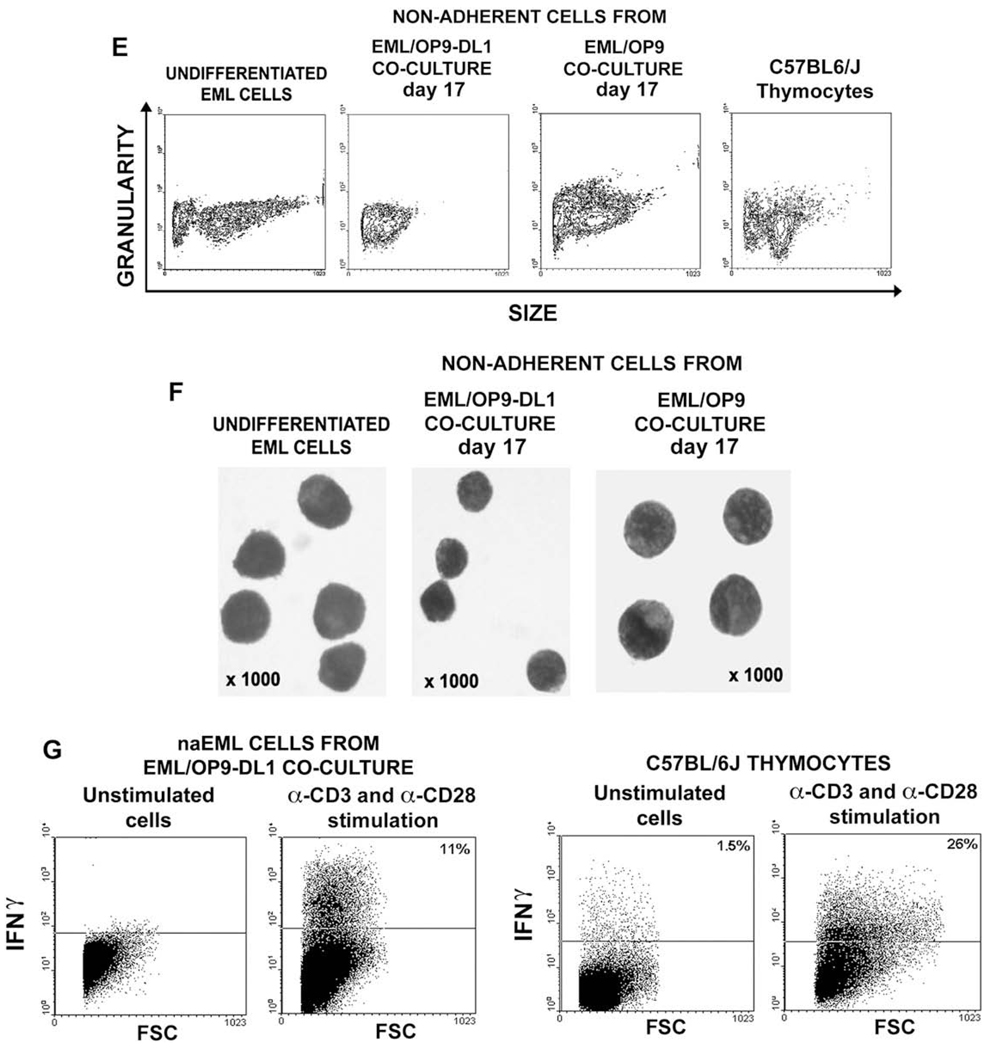
Development of CD4+ and CD8+ T-cell receptor (TCR)-expressing cells in EML/OP9 stromal cells expressing Notch ligand Delta-like 1 (OP9-DL1) cocultures. (A) In cocultures with OP9-DL1 stroma EML cells give rise to CD4+CD8+ double-positive (DP) cells and CD4+CD8− and CD8+CD4− single-positive (SP) cells, which were completely absent in EML/OP9 cocultures. (B) The majority of CD4+ and CD8+ cells from EML/OP9-DL1 cocultures expressed CD3-TCR-complex. (C) Analysis of TCR-αβ and TCRγδ expression on undifferentiated EML cells, and nonadherent EML (naEML) from EML/OP9 and EML/OP9-DL1 cocultures has revealed that EML cells in OP9-DL1 cocultures differentiate into cells resembling TCR-expressing T cells. The contour plots on the lower left show the percentage of TCR-αβ–expressing naEML cells from two separate EML/OP9-DL1 cocultures. Also, all TCRαβ–expressing naEML cells coexpress CD3 as well. (D) Reverse transcription polymerase chain reaction (RT-PCR) and flow cytometry analysis of expression pattern of TCR-Vβ3.1, 4, 5.1, 8-1, 11, 12, and 14 chains in undifferentiated EML cells, thymocytes and naEML from EML/OP9-DL1 co-cultures. The naEML cells from OP9-DL1 cocultures start to transcribe TCR-Vβ4 chain on day 7 of coculture, and TCR-Vβ8-1.2 and 11 chains on day 17 of coculture. Flow cytometry analysis has revealed that naEML cells from day 17 EML/OP9-DL1 cocultures express TCR-Vβ4, TCR-Vβ8-1.2, and TCR-Vβ14 chains, but do not express TCR-Vβ5.1 chain, thus corroborating RT-PCR results. (E) Flow cytometry analysis of the size of undifferentiated EML cells, naEML cells from EML/OP9-DL1 and EML/OP9 cocultures, and thymocytes from C57BL/6 J mice. (F) Comparison of the morphology of undifferentiated EML cells, and naEML cells from day 17 EML/OP9-DL1 and EML/OP9 cocultures. Cells were deposited on glass slides, stained with May-Grünwald/Giemsa and photographed using a Zeiss Axiovert microscope at × 1000 magnification. (G) The naEML cells from OP9-DL1 cocultures produce interferon-γ in response to TCR activation. The naEML cells from day 17 EML/OP9-DL1 cocultures and C57BL/6 J thymocytes were stimulated with plate-bound α-CD3 and α-CD28 for 72 hours. IFN-γ production was measured by intracellular staining of unstimulated and stimulated cells, followed by flow cytometry analysis. FITC = fluorescein isothiocyanate; PE = phycoerythrin.


