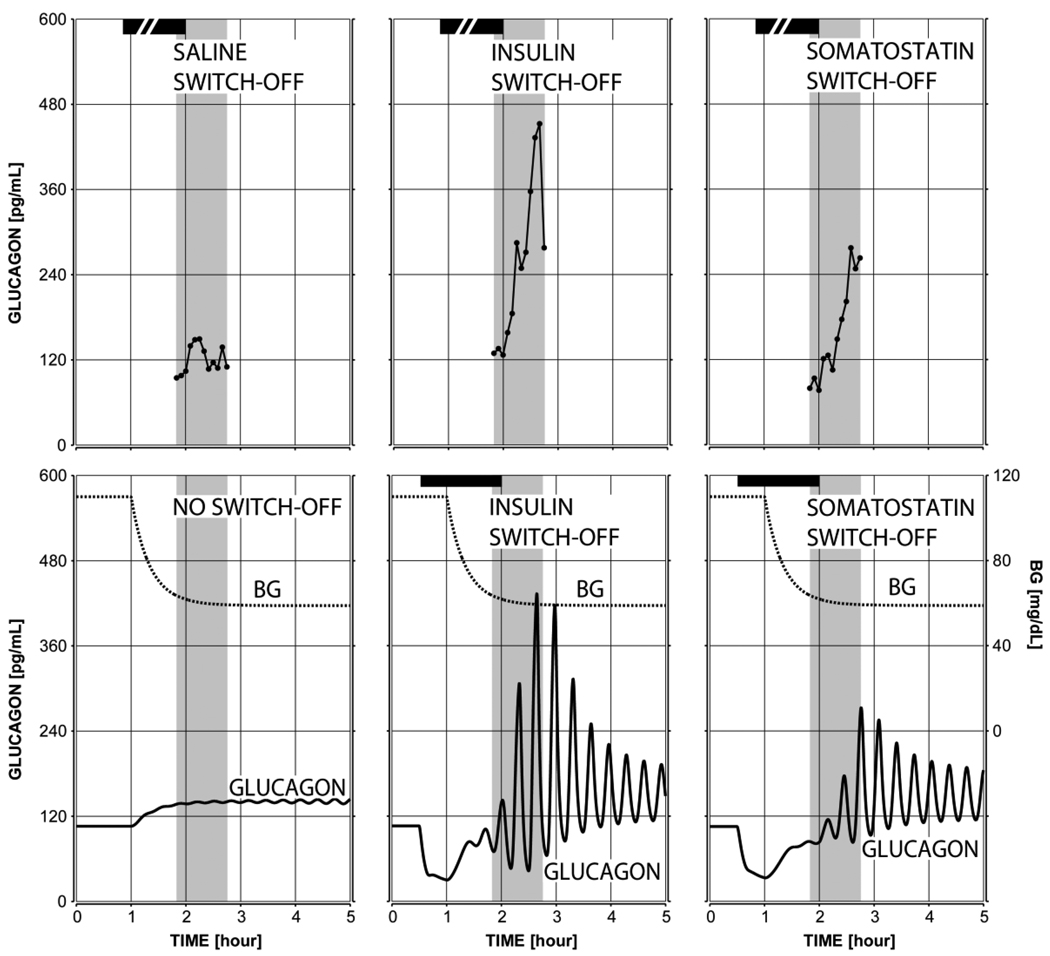
Figure 4.
The mean observed (top) and model-predicted (bottom) glucagon response to hypoglycemia and saline switch-off or no switch-off (left), insulin switch-off (middle), and somatostatin switch-off (right). The shaded area marks the period monitored in our experimental study. The simulations were performed with a complete insulin deficiency.

