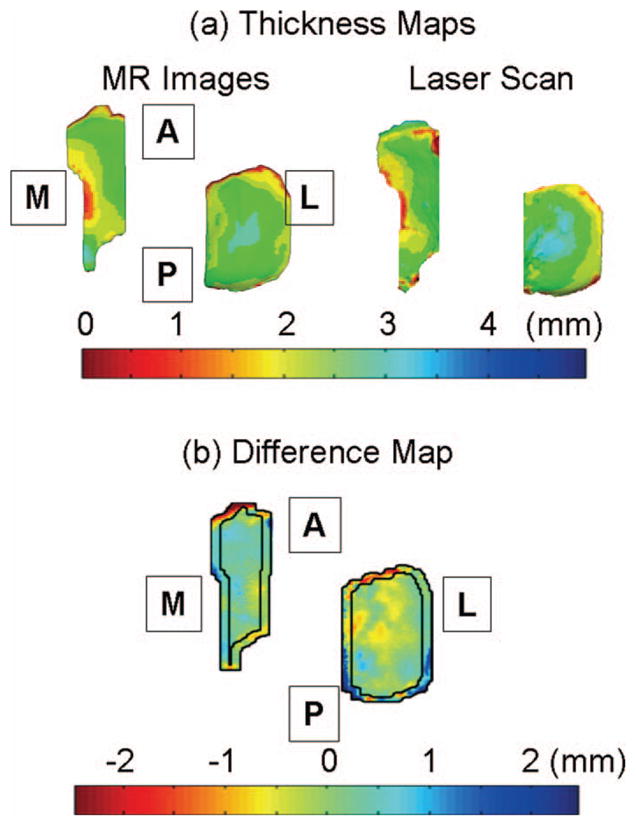
Fig. 2.

(a) Thickness maps calculated from a MR image-based 3D model and a laser-scan based 3D models. Dark blue represents the thickest cartilage and dark red represents the thinnest cartilage as shown in the color bar. (b) Difference maps were calculated by subtracting the thickness maps from the laser-scan based 3D model from the MR image-based 3D model. Thus blue regions represent thickness overestimation in MR image-based 3D models, green regions show the same estimation, and red regions represent underestimation. The letters A, P, M, and L in boxes represent anterior, posterior, medial, and lateral, respectively.
