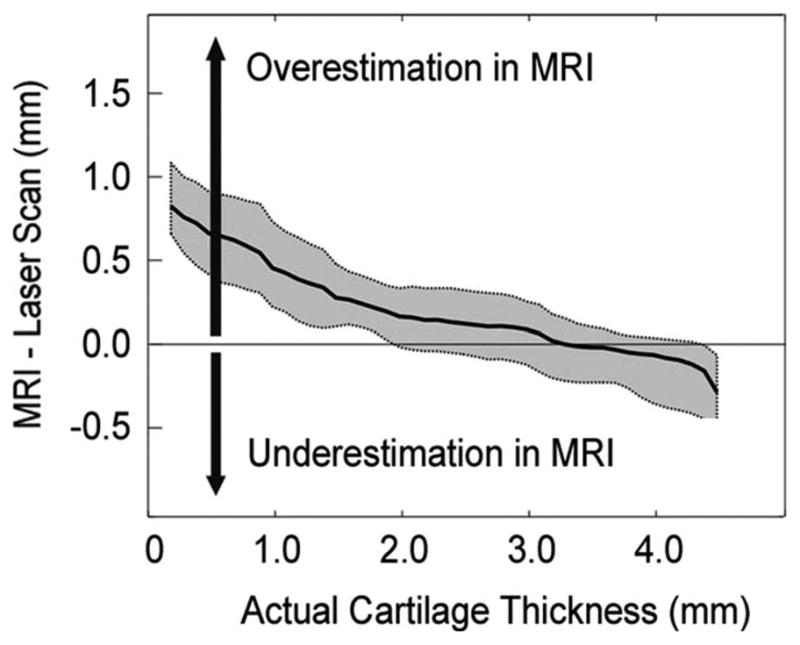
Fig. 3.

Differences in thickness measurement between MRI based 3D models and laser-scan based 3D models were calculated point by point for each of the specimens. This graph is from one of the tested specimens. Positive values represent thickness overestimation in MR image-based measurements. The median of the difference was drawn as solid lines, and 25% and 75% quartiles were drawn as dotted lines.
