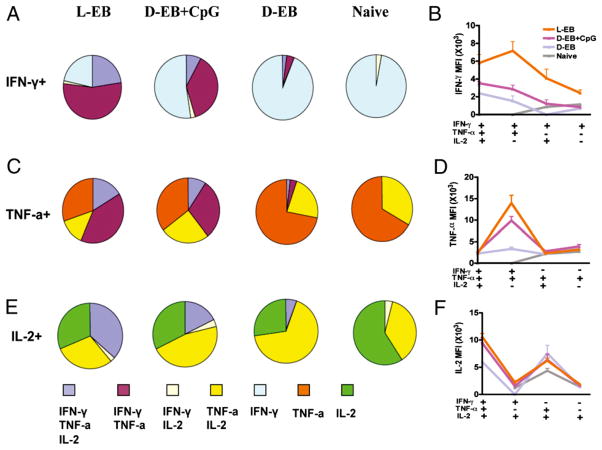
FIGURE 4.
The IFN-γ, TNF-α, and IL-2 MFI and fraction of Ag-specific triple-, double-, and single-positive cells for each vaccine group. EB-specific cytokine productions from splenocytes of vaccinated mice before challenge were analyzed by multiparameter flow cytometry. The fraction of IFN-γ (A), TNF-α (C), and IL-2 (E) EB-specific triple-, double-, and single-positive cells for each vaccine group. The MFI of IFN-γ (B), TNF-α (D), and IL-2 (F) EB-specific triple-, double-, and single-positive cells for each vaccine group. Three or four mice were in each group. Shown are results representative of two experiments. D-EB, dead EBs; L-EB, live EBs.

