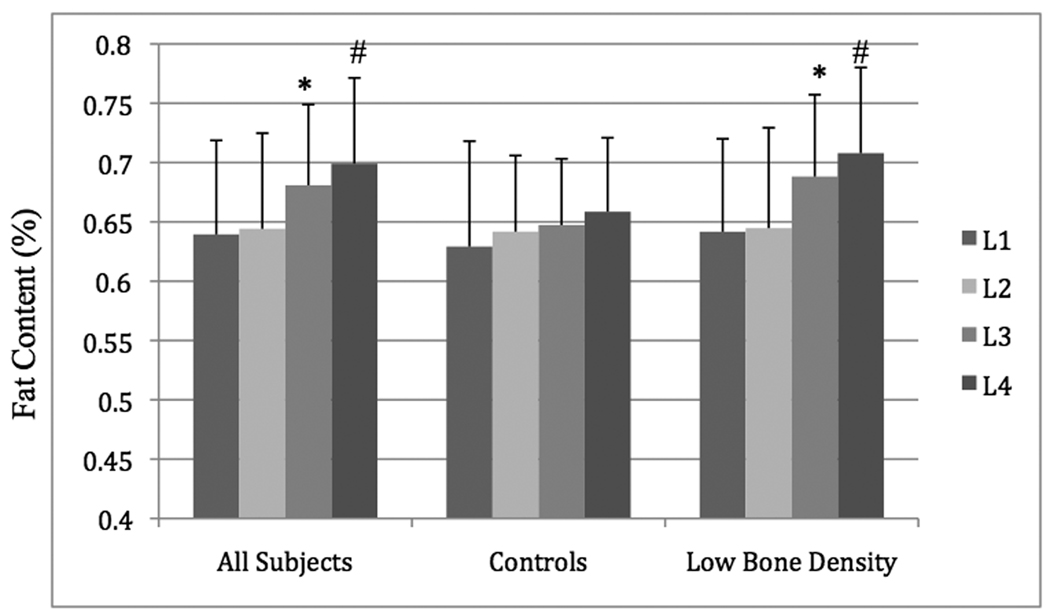
Figure 3.
Bar graph of vertebral fat content at L1, L2, L3 and L4 in all subject, healthy controls, and patients with low bone density. Marrow fat content increased significantly from L1 to L4. In patients with low bone density, the fat content at L3 was significantly higher than at L2, and the fat content at L4 was significantly higher than at L3. Fat content between L1 and L2 was not significantly different. (*P < 0.05 between L2 and L3. #P < 0.05 between L3 and L4.)

