
Figure 3.
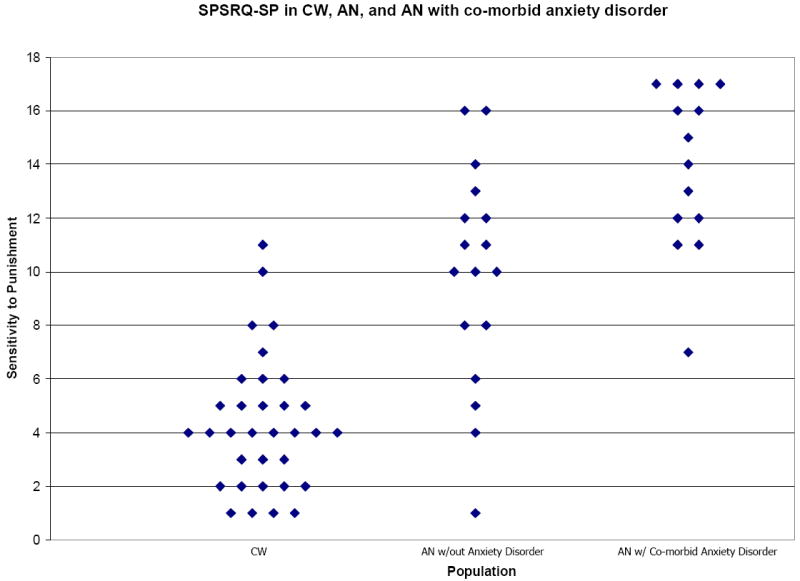
Scatter plot graph for SPSRQ Sensitivity to Punishment subscale data comparing healthy control participants (CW; n=33) to anorexia nervosa (AN) without concurrent anxiety disorder (n=17) and AN with a co-morbid anxiety diagnosis (n=14). Data yielded significant differences in SP scores between all three groups (F=51.23): CW and AN without anxiety disorder (p<0.00001) and with anxiety disorder (p<0.00001), as well as between AN with and without anxiety disorder (p=0.003).