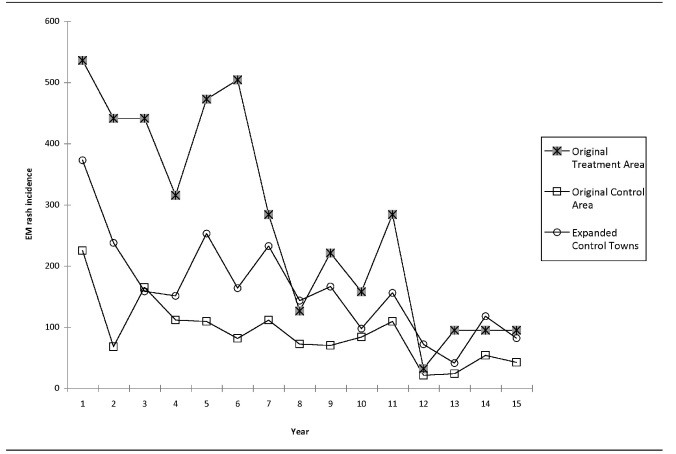
Figure 2.
Annual incidence of Lyme disease cases per 100,000 population in the four-poster original treatment area, original control area, and expanded control towns:a Connecticut, 1992–2006b
aThe original treatment area is a four-poster treatment area; the original control area is a similar area in Old Saybrook, Connecticut; expanded control towns include surrounding towns of Clinton, Deep River, East Haddam, East Lyme, Haddam, Killingworth, Old Lyme, and Old Saybrook.
bThe after treatment period is 1999–2006.
EM = erythema migrans

