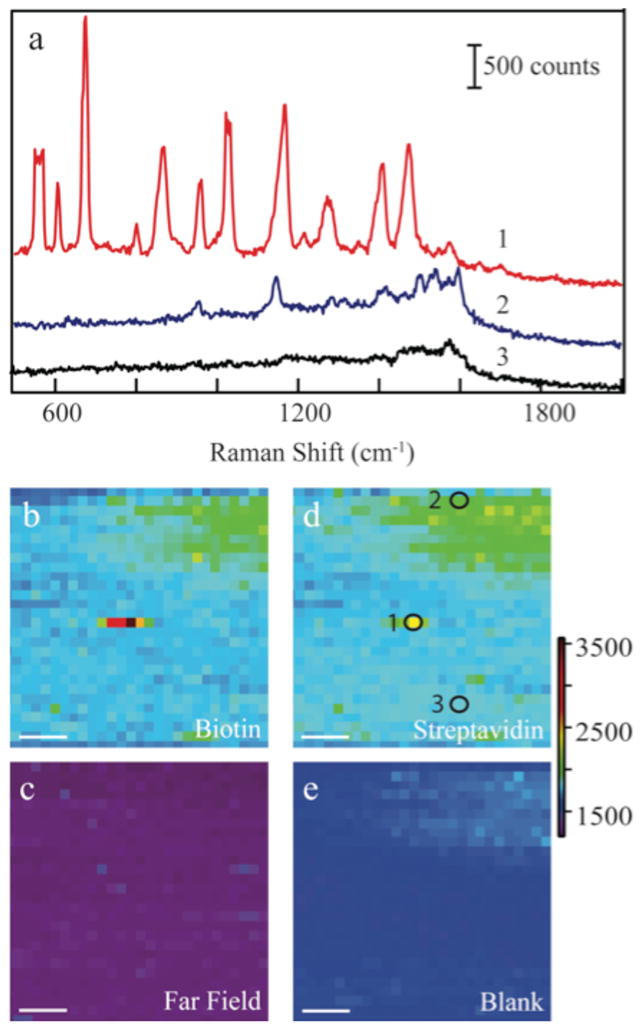
Figure 1.

The Raman spectra (a) from selected points of the TERS image are shown. Peak assignments are provided in the electronic supplemental information. The Raman maps are displayed corresponding to the 680 cm−1 band of biotin (b) with and (c) without the TERS tip, the Streptavidin 962 cm−1 feature (d) with the TERS tip, and of (e) a blank region at 1800 cm−1. The circles and numbers in Fig. 1d correspond to the numbered spectra in panel a. The scale bar in all images (b–e) is 100 nm.
