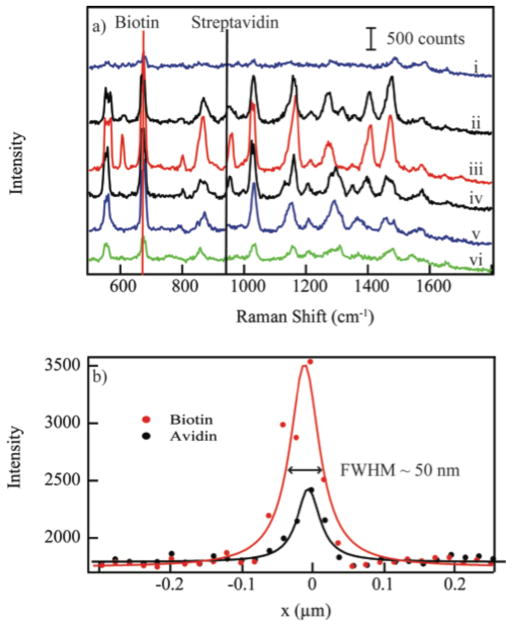
Figure 2.
The upper graph shows Raman spectra in line with the biotin-labeled nanoparticle at (i) 40 nm, (ii) 20 nm, (iii) 0 nm, (iv) −20 nm, (v) −40 nm, and (vi) −60 nm from the centroid of the nanooparticle. The lower graph depicts the intensity profile associated with the 680 cm−1 and 962 cm−1 band of biotin and streptavidin, respectively. The FWHM of both traces is 50 nm. The points are experimental data, the solid line is a fit to a Lorentz line.

