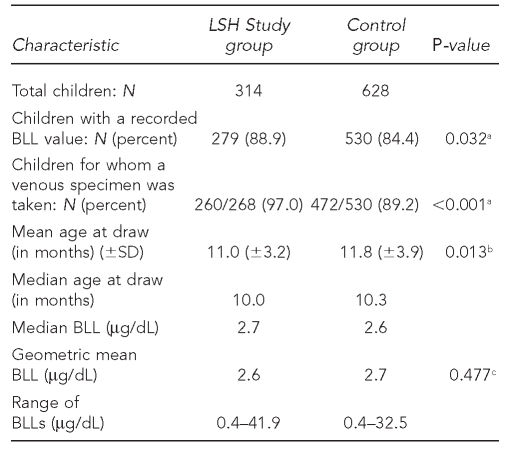
Table 3.
Comparison of the study cohort and control group BLL values: Philadelphia Lead Safe Homes Study
aP-values are one-tailed significance for Chi-square test.
bP-values are two-tailed significance for Mann-Whitney U test.
cP-values are two-tailed significance for unpaired t-test.
BLL = blood lead level
LSH = Lead Safe Homes
SD = standard deviation
μg/dL = microgram per deciliter

