Figure 3.
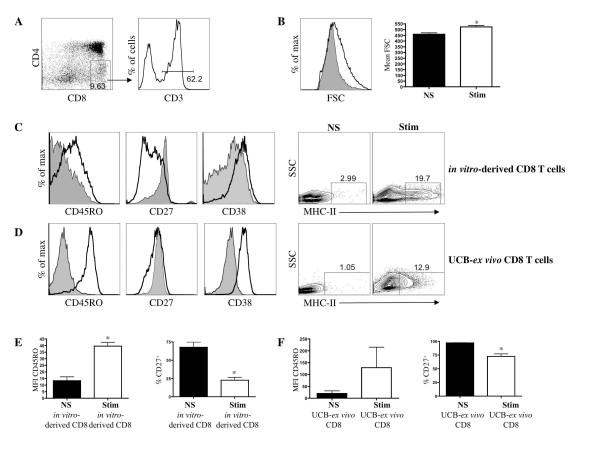
Characterization of activation marker status on activated CD8+ T cells generated in vitro. (A) Day 60-70 HSC/OP9-DL1 coculture-derived CD8 SP T cells were purified as shown, CD8+ CD4- and CD3+, and stimulated anti-CD3/CD28 mAbs for 5 days. (B) Left-side panel displays flow cytometric analyses of cell size measured by Forward-light Scatter (FSC) intensity; right-side panel displays mean FSC for non-stimulated (NS) and stimulated (Stim) CD8+ CD3+ cells (n = 5; p = 0.004; t-test). (C) Flow cytometric analyses for the expression of CD45RO, CD27, CD38 and MHC-class II for stimulated (Stim) and non-stimulated (NS) CD8+ CD3+ cells (solid black line and shaded histograms, respectively). (D) Flow cytometric analyses for the expression of CD45RO, CD27, CD38 and MHC-class II for stimulated (Stim) and non-stimulated (NS) CD8+ CD3+ cells obtained from the UCB Lin+ fraction. Analysis of CD45RO mean fluorescence intensity (MFI) and percentage of CD27+ cells for (E) HSC/OP9-DL1 coculture (in-vitro)-derived CD8+ CD3+ T cells and (F) UCB-ex vivo CD8+ CD3+ T cells were performed (MFI CD45RO in vitro-derived, p = 0.02; n = 3; t-test; %CD27+ in vitro-derived, p = 0.007; n = 3; t-test; %CD27+ UCB-ex vivo, p = 0.03; n = 2; t-test). * indicates statistical significance.

