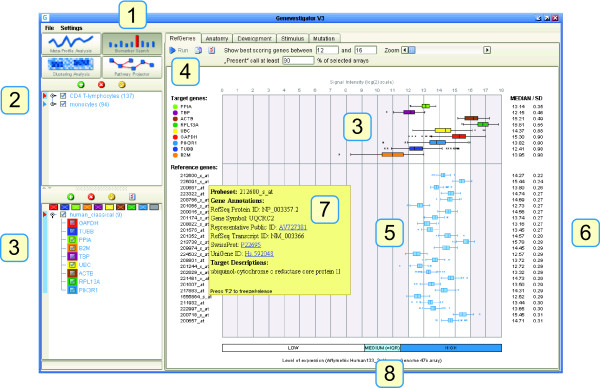
Figure 5.
Graphical user interface of the RefGenes tool in Genevestigator. 1) The RefGenes tool belongs to the Biomarker Search toolset. 2) Panel for the selection of arrays associated with various experiments or conditions. 3) Panel for the selection of genes (target genes or commonly used reference genes for comparison). These genes are represented in the graph on the right with box and whiskers plots of signal intensity. In this example, the box and whiskers plots of expression in T-lymphocytes of 8 commonly used reference genes and a target gene (PIK3R1) are shown. 4) RefGenes toolbar, with fields to de fine the range of signal intensity within which new reference genes must be searched. The search for reference genes is triggered by a click on the "Run" button. 5) Box and whiskers plot of signal intensity of the new reference genes proposed by RefGenes. 6) The numerical values of the median and standard deviation of signal intensity are shown. 7) For each reference gene proposed by RefGenes, additional information is available in the mouse-over tooltip. 8) The typical range of low, medium, and high expression is shown for the array type chosen in (2). Medium is defined as the interquartile range (IQR).

