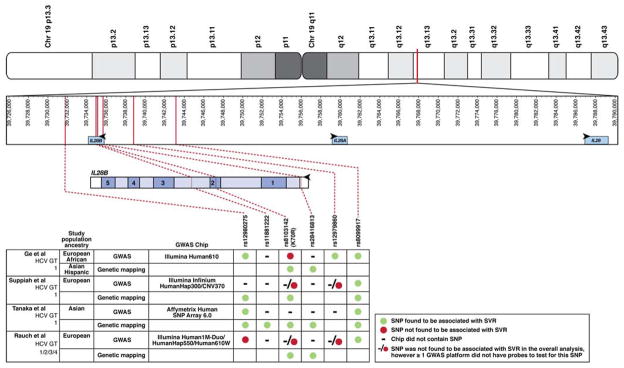
Fig. 1. SNPs in IFNγ Gene Cluster Associated with HCV Control.
The IFNγ gene cluster is shown in the top panel indicating its position on Chromosome 19. In the second panel the positions of the relevant SNPs corresponding to the text and published data are indicated in relation to the IFNγ gene cluster.10, 12–14 IL28B is upstream and in reverse orientation compared with IL28A. The third panel depicts the genomic structure of IL28B, including its 5 exons, intervening introns, and flanking putative regulatory regions. Vertical lines denote the position of individual SNPs that are associated with HCV treatment response; these are connected by hashed lines to the adjoining table. The only SNP that is in a coding region encodes K70R; it causes an A > G polymorphism on the negative, coding strand and a T > C polymorphism on the positive, non-coding strand. The bottom panel shows which SNPs were associated with response to treatment in each of the indicated studies, including those that were found by genetic mapping studies. As indicated in the legend, symbols are used to indicate if a given SNP was associated with SVR in each of 4 GWAS and genetic mapping studies. ● SNP was associated with SVR; ● SNP was not associated with SVR; −/● SNP was not found to be associated with SVR in the overall analysis, however ≥1 GWAS platform did not have probes to test for this SNP.

