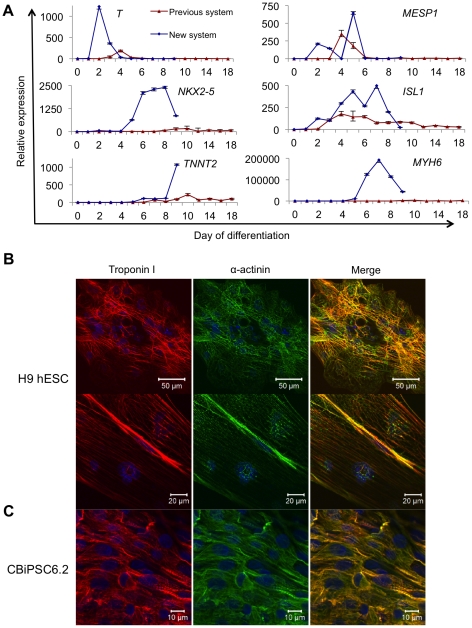
Figure 5. Characterization of hPSC cardiomyocyte differentiation.
(A) Comparison of real-time RT-PCR for markers of mesoderm (T, MESP1), cardiac progenitors (NKX2.5, ISL1), and cardiomyocytes (TNNT2, MYH6) during hESC differentiation using either the Previous system or New system. Analysis was performed using the ΔΔCt method with relative expression calculated using d0 of differentiation (hESC samples) as baseline. 18S RNA expression was used for normalization. Primers are shown in Table S1. (B) Immunocytochemistry for cardiac markers in hEB differentiated from H9 hESC. Troponin I (red), α-actinin (green) and DAPI (blue) at low power (top panels) demonstrating unaligned striations throughout the hEB and higher power (lower panels) demonstrating area of aligned striation. (C) Immunocytochemistry for cardiac markers in hEB differentiated from CBiPSC6.2.

