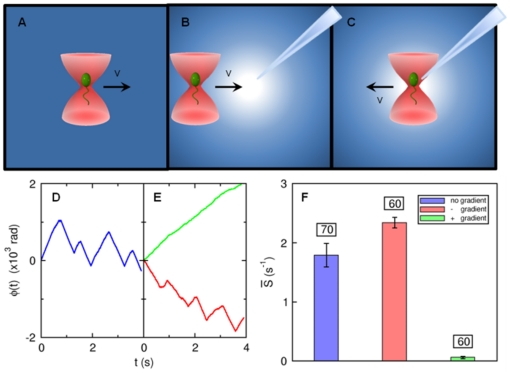
Figure 1. Probing bacterial chemotactic response with an optical tweezers.
To investigate cell's response to a chemoattractant gradient, a micropipette filled with  of serine was used. The concentration profile is determined by molecular diffusion [41]. (A) is a control experiment in which a V. alginolyticus cell was dragged at a speed
  in a uniform TMN buffer to obtain its steady-state switching rate. In (B), the cell was trapped
  away from the tip and then dragged towards it for
  at the same speed. In (C), a cell was initially trapped at a distance
  from the tip and was then dragged away from it for
  at the same speed. In (D), the flagellar motor rotation angle (or the winding angle) as a function of time
  is measured in the optical trap when the trapped cell was moved in the motility buffer without chemoattractant. In (E), the bacterium was moved towards (green) and away from (red curve) the source of attractant. In the homogeneous medium (D), the motor reverses its direction roughly once every
  . However, when the cell is moving up the gradient (green in (E)) the motor reversal is completely suppressed. When the same cell was moved down the gradient, frequent motor reversals from CW
 CCW were again observed. In (F), the average switching rates
  for the three different stimuli are displayed. The blue bar is for the steady-state case, while the green and the red bars are for cells moving up and down the gradient, respectively. We noticed that there was only a small difference when the cell was forced to move away from the source compared to the steady-state case. The error bars are standard errors of the mean calculated based on the cell numbers indicated above the bars.

