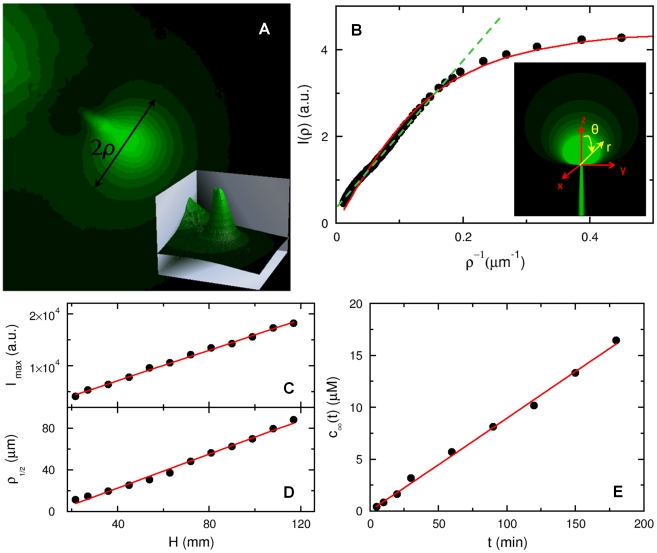
Figure 6. The chemoattractant concentration profile.
(A) To visualize the concentration profile of serine, a micropipette was filled with  fluorescein and a small hydrostatic pressure was applied by a water column to maintain a continuous flow of dye into the sample chamber. The height of the water column was set to
  and kept fixed in all measurements. The fluorescence intensity distribution after the background subtraction is displayed in (A) and in the inset. In (B), the measured intensity
  is plotted against
  , where
  is along the radial direction as delineated in (A). In the far field,
  is proportional to
  as displayed by the dashed green line, which is expected from the calculation. The solid line is the fit to Eq. 6, which captures both the near- and far-field behaviors. The inset is a computer generated plot of the dye distribution according to Eq. 3, where
  and the same coordinate system is used as in the calculation. In (C and D), the fluorescence peak intensity (
 ) and the half-width at half-height (
 ) were measured as a function of the water column height
  . In (E), the micropipette was filled with
  of fluorescein, and the mean fluorescein concentration in the sample chamber (with a total volume of
  ) was measured as a function of time
  .
.

