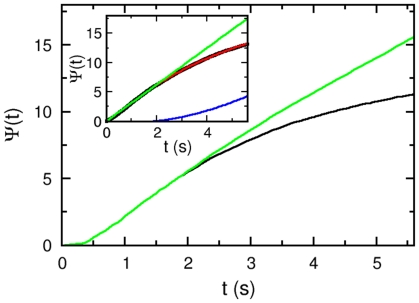
Figure 7. Normalized cumulative distribution functions (CDFs).
The measured CDF (black) can be mimicked by the function  (red), which is given in short times (
 ) by
) by  and in long times (
 ) by
) by  , where
  is the initial switching rate, and
  . The experimental data after the photodamage correction
  , which is represented by the blue line, yields the green line. In the main figure, the same correction function
  is applied to the measurement (black) when
  of serine is present. The resulting curve is presented in green.

