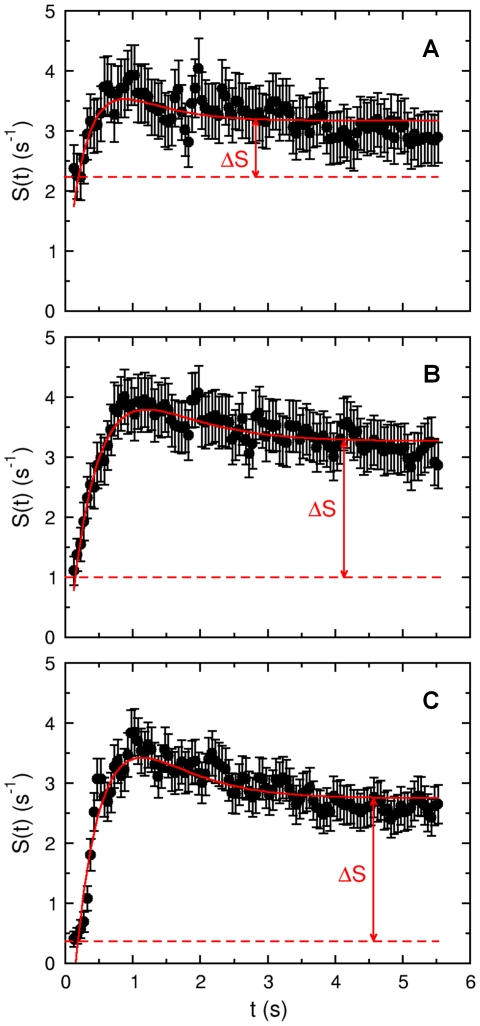
Figure 8. The time-dependent switching rate of V. alginolyticus.
The measured switching rates for  1, 5 and 10
  of serine are plotted as dots in (A to C), respectively. The stimulation occurs at
  . In all the cases, an initial suppression in
  was followed by an overshoot beyond the steady-state switching rate
  . It is only in long times that
  is recovered. The red curves in each plot are the fits using Eq. 15. The fitting procedure yields the following parameters:
  ,
,  , and
, and  for (A);
  ,
,  , and
, and  for (B); and
  ,
,  , and
, and  for (C). Here, we treated
  as an adjustable parameter; as can be seen, its value does not change much from run to run.

