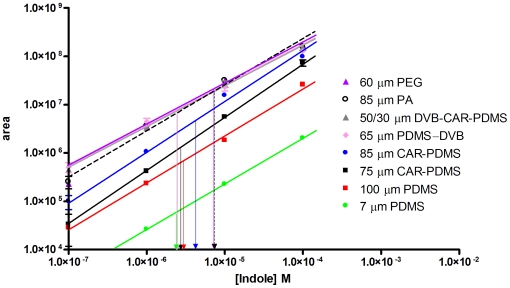
Figure 4. Indole standard curves generated by headspace SPME.
Chromatographic peak area is plotted as a function of indole concentration, illustrating fiber-dependent differences in the partition coefficient for indole. Peak areas taken from Fig. 3 were used to determine the concentration of indole extracted using each fiber (arrows).

