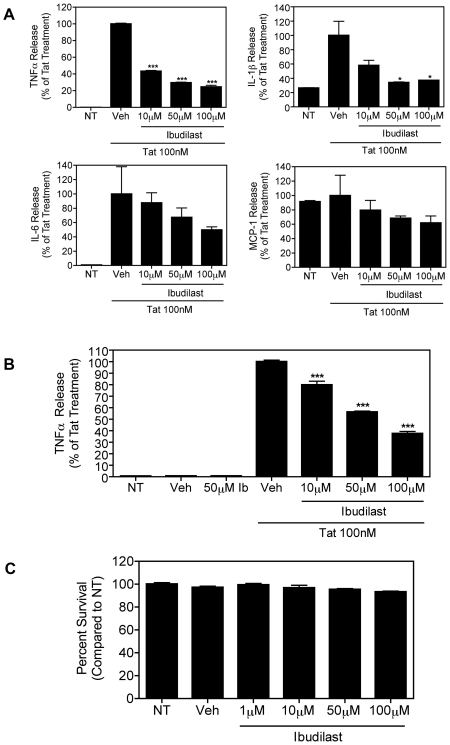
Figure 1. Ibudilast dose-dependently inhibits Tat-induced pro-inflammatory cytokine production in microglial cells.
A, Human microglial cells (1×10⁵) were left untreated (NT) or were treated with Tat (100 nM) for 8 h with or without pre-treatment for 30 min. with increasing concentrations of ibudilast or vehicle (Veh), as indicated. TNFα, IL-1β, IL-6, and MCP-1 levels in culture supernatants were analyzed by Multi-Plex cytokine array, as described in Methods. The Tat+Veh-treated samples were set to 100% and all other samples were compared to this value. Results are shown as mean ± SD of values derived from two replicates from a single representative experiment. Statistical significance (***, p<0.001; *, p<0.05) is indicated, as compared to Tat+Veh-treated cells. The average cytokine/chemokine concentration of the Tat+Veh-treated sample was as follows; TNFα: 8166 pg/mL, IL-1β: 3.3 pg/mL, IL-6: 6027 pg/mL, and MCP-1: 1480 pg/mL. B, Similarly, murine microglial cells (BV-2; 1.2×10⁵) were left untreated (NT) or were treated with Tat (100 nM) for 8 h with or without pre-treatment for 30 min. with increasing concentrations of ibudilast or vehicle (Veh), as indicated. TNFα release was measured by ELISA. Results are shown as mean ± SEM of values derived from three replicates from a single representative experiment; three total experiments were performed. Statistical significance (p<0.001) is indicated, as compared to Tat+Veh-treated cells (***). The TNFα concentration of the Tat+Veh-treated sample was 1861 pg/mL. C, BV-2 cells (1.2×10⁵) were left untreated (NT) or were treated with increasing concentrations of ibudilast or vehicle (Veh), as indicated, for 8 h. The MTT assay was used as a measure of cell viability. Percent survival was calculated as compared to the untreated sample. Results are shown as mean ± SEM of values derived from four replicates from a single representative experiment; two total experiments were performed.

