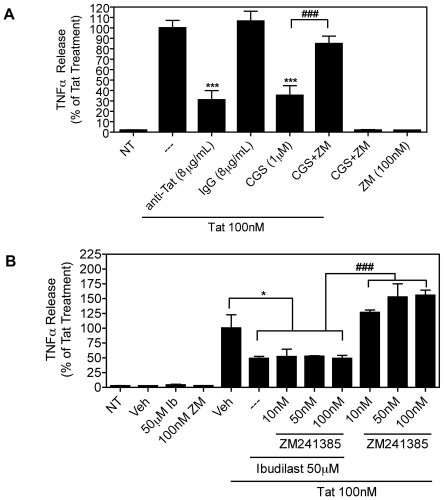
Figure 2. Inhibition of Tat-induced TNFα production by ibudilast is not reversed by blockade of adenosine A2A receptor.
A, BV-2 cells (1.5×10⁵) were left untreated (NT) or were treated with Tat (100 nM) for 8 h with or without pre-treatment for 30 min. with either anti-Tat or control IgG antibodies (8 µg/mL) or adenosine A2A receptor agonist, CGS21680 (CGS, 1 µM) or antagonist, ZM241385 (ZM, 100 nM), as indicated. TNFα release was measured by ELISA. The Tat-treated samples were set to 100% and all other samples were compared to this value (the TNFα concentration for this sample was 3475 pg/µg total protein content). Results are shown as mean ± SEM of values derived from four replicates from a single representative experiment; two total experiments were performed. Statistical significance (p<0.001) is indicated, as compared to Tat-treated cells (***) or as compared to Tat+CGS-treated cells (###). B, BV-2 cells (1.2×10⁵) were left untreated (NT) or were treated with Tat (100 nM) for 8 h with or without pre-treatment for 30 min. with ibudilast (Ib, 50 µM) or vehicle (Veh) alone or together with increasing concentrations of the adenosine A2A receptor antagonist, ZM241385, as indicated. TNFα release was measured by ELISA. The Tat+Veh-treated samples were set to 100% and all other samples were compared to this value (the TNFα concentration for this sample was 696.2 pg/mL). Results are shown as mean ± SEM of values derived from three replicates from a single representative experiment; two total experiments were performed. Statistical significance is indicated, as compared to Tat+Veh-treated cells (p<0.05, *) or as compared to Tat+ZM241385-treated cells (p<0.001, ###).

