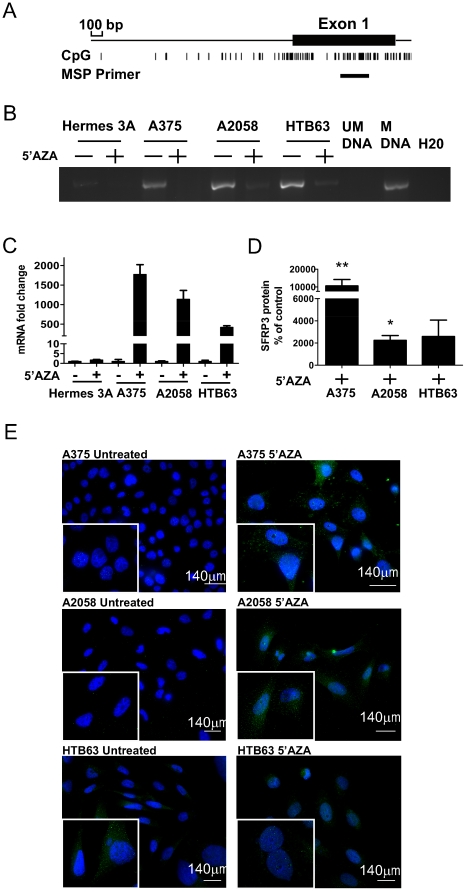
Figure 2. Methylation of SFRP3 in melanoma cell lines.
A, Schematic representation of the promoter region together with the first exon of the SFRP3 gene. The CpG rich areas and the site of the methylation specific PCR primer are indicated. B, Methylation specific PCR. Hermes 3A, A375, A2058 and HTB63 cells were treated for 72 h with 5 µM 5′AZA and analyzed using methylation specific PCR. Universally unmethylated DNA (UM DNA) and methylated DNA (M DNA) were used as negative and positive controls, respectively. The image is representative of at least 3 independent experiments. C, SFRP3 mRNA expression after demethylation treatment. Hermes 3A, A375, A2058 and HTB63 cells were treated with 5′AZA as in B and relative mRNA expression of SFRP3 was analyzed using RT-QPCR. The graph is representative of data from 3 independent experiments and error bars denote SD within one experiment. The relative expression of each cell line is normalized to the untreated control of the same cell line. D, SFRP3 protein levels in the media from the indicated cell lines after demethylation treatment. A375, A2058 and HTB63 cells were treated as described for B and the SFRP3 protein content analyzed using the ELISA kit as described in Figure 1. The results are given as a percentage compared to non-demethylated control cells. Error bars represent SEM (n = 4). E, SFRP3 protein expression in the melanoma cell lines. The indicated melanoma cell lines were analyzed for their SFRP3 content by fluorescence microscopy after demethylation treatment using non-treated cells as controls. Representative immunofluorescence images from at least 3 independent experiments. * = p<0.05, ** = p<0.01.

