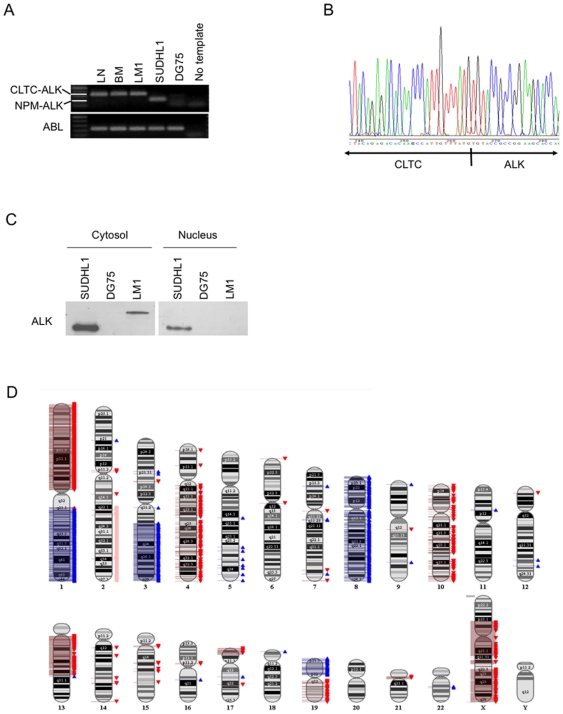
Figure 2. Genetic characterization of the LM1 cell line.
A: The presence of the CLTC-ALK translocation in the patient's lymph node (LN), bone marrow infiltrating tumor cells (BM) and the established cell line (LM1) was determined with RT-PCR. The ALCL cell line SU-DHL1 was used as positive control for the NPM-ALK translocation. The BL cell line DG75 was used as negative control for both translocations involving ALK. ABL was used as loading control. B: Sequencing analysis indicated the presence of the CLTC-ALK fusion transcript in the LM1 cell line. C: Western blot for ALK showing exclusive cytoplasmic localization in the LM1 cell line corresponding to the expected molecular weight of the ALK-CLCT fusion protein. SU-DHL1 showed nuclear and cytosolic localization of Alk1 secondary to the NPM-ALK translocation. DG75 was used as negative control. D: SNP profiling of the LM1 cell line. Gains and losses are indicated in blue and red, respectively. Due to the nearly tetraploid chromosome status of this cell line the single loss of one copy in 2q22.1-qtel not detected by the software was determined manually (light red).

