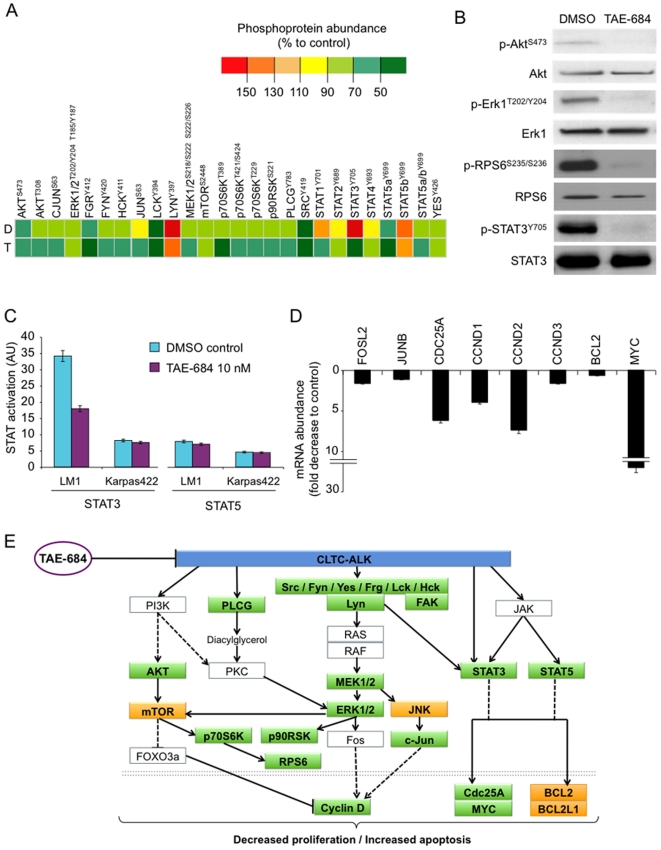
Figure 4. TAE-684 inhibits signalling downstream of CLTC-ALK in LM1 cells.
A: Phosphoprotein abundance in LM1 cells treated with DMSO (D) or TAE-684 10 nM for 4 h (T). The heat map represent the relative abundance normalized by the positive control in the proteome array (see also Supp. Fig. 2). The particular protein residue phosphorylated is shown as superscript. B: Western blot for phospho-ALK, ALK, phospho-ERK1, ERK1, phospho-RPS6, RPS6, phospho-STAT3 and STAT3 in cytosol lysates of LM1 cells treated with DMSO or TAE-684 10 nM for 4 h. C: STAT 3 and STAT5 DNA binding activity (Y-axis, arbitrary units, AU) in Karpas422 and LM1 cells treated with DMSO (representing the baseline activity) and after 4 h of exposure to 10 nM of TAE-684. Experiments represent duplicates with SEM. D: Transcript abundance for FOSL2, JUNB, CDC25A, CCND1, CCND2, CCND3, BCL2 and MYC in LM1 cells treated with DMSO (control) or TAE-684 10 nM for 12 h. Data was normalized to RPL13A levels. Data is presented as fold decrease compared to control (DMSO treated cells). E: Signaling pathways modified in LM1 cells by treatment with TAE-684. Phosphoproteins (transcripts are represented bellow the double dotted line) with significant decreases by TAE-684 are shown in green boxes, with no changes in yellow boxes and those not determined in white boxes.

